
Interactive Demos
Experience the power of Shinka Dynamics firsthand.
We transform complex data into powerful business decisions.
Select a module below to see how our custom AI models process data,
identify patterns, and deliver real-time insights
Demo 01 – Postal Delivery Automation System (PDAS)
Transforming Postal Delivery with AI and Automation in Japan
Businesses face immense challenges processing high volumes of daily envelopes and letters. Extracting complex sender data—including names, companies, addresses, phone numbers, and emails—is a significant operational hurdle. In Japan, this is uniquely difficult due to the need to recognize Kanji, Katakana, and Hiragana scripts. Wide variations in handwritten text further complicate matters and increase manual entry errors. Relying on manual data entry causes operational delays, slows down processing times, and inevitably introduces mistakes into the system.
The Shinka Dynamics Solution: We deployed a complete digitalization solution to handle documents, containers, and mail items automatically.
- Custom OCR Engine: We developed specialized text recognition capabilities specifically trained for Japanese scripts and handwritten content.
- Mobile-First PWA: A Progressive Web App designed specifically for the smartphones used by delivery workers on the ground.
Seamless Operator Workflow:
- Secure Login: Operators authenticate using their existing CRM credentials.
- Shift Setup: Quick selection of the date and contract store location.
- Mail Registration: Rapid processing via ID search or instant camera capture utilizing our OCR.
- Data Review: Operators easily view customer info, history, and balances.
- Final Submission: Processing is completed with total confidence.
The Impact:
- Speed Improvement: Dramatically reduces delivery times through end-to-end automation.
- Cost Reduction: Eliminates the need for manual data entry and lowers courier expenses.
- Error Elimination: Removes human error entirely from the data entry process.

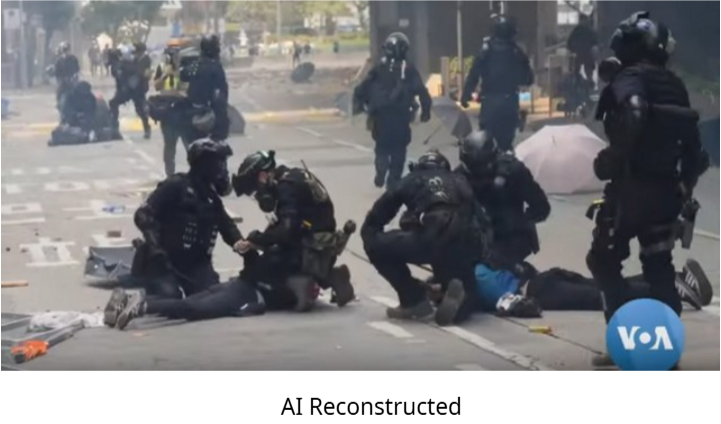
Demo 2: SOTA Deep Fake & Synthetic Media Detector
Test our detection algorithms against visually identical reconstructed images.
The Interactive Element: A slider or toggle switch allowing the user to compare a “Real Image” with an “AI Reconstructed Image” (e.g., generated via SDXL, VAE, or GAN).
What the User Sees: To the human eye, both images look completely real. When the user clicks “Run AI Analysis,” the dashboard reveals the hidden algorithmic fingerprints and assigns a confidence score, accurately flagging the reconstructed image as fake.
Key Takeaway Text: DeepFake detection is essential for media trust and social safety. Our robust algorithms identify manipulated media even when subtle artifacts are completely invisible to the human eye.

Demo 3: Industrial Computer Vision (Truck-Crane Automation)
Move from reactive decision-making to proactive strategy
The Interactive Element: A dropdown menu where users can choose to explore the Potential Crime Prediction System or the Political Instability Monitor.
What the User Sees:
- Crime Prediction: The user selects a Unit Type (e.g., Metro), Police Station (e.g., Mirpur), and a time period. The system generates a map with precise locations and high probabilities of criminal activity.
- Political Instability: The user adjusts sliders for factors like “Infant mortality,” “Type of government,” and “Living conditions”. The system instantly calculates the likelihood of a country facing civil war and provides a transparent explanation of which factors influenced the score.
Key Takeaway Text: Anticipate shifts before they happen. Whether optimizing law enforcement patrols or providing early warnings for global conflicts, our predictive analytics process massive data volumes to keep people safe and resources optimized.

Demo 4: Predictive Analytics Engine
Move from reactive decision-making to proactive strategy.
The Interactive Element: A dropdown menu where users can choose to explore the Potential Crime Prediction System or the Political Instability Monitor.
What the User Sees:
- Crime Prediction: The user selects a Unit Type (e.g., Metro), Police Station (e.g., Mirpur), and a time period. The system generates a map with precise locations and high probabilities of criminal activity.
- Political Instability: The user adjusts sliders for factors like “Infant mortality,” “Type of government,” and “Living conditions”. The system instantly calculates the likelihood of a country facing civil war and provides a transparent explanation of which factors influenced the score.
Key Takeaway Text: Anticipate shifts before they happen. Whether optimizing law enforcement patrols or providing early warnings for global conflicts, our predictive analytics process massive data volumes to keep people safe and resources optimized.

Ready to integrate these tools into your workflow?